Tracing
Every run of a deployed agent is traced automatically. Traces are how you see what an agent actually did — step by step, with the inputs, outputs, and cost of each run — and they're collected in your own account.
What a trace records
A run is captured as a tree of spans: the top-level graph, each model call,
and each tool call. For a typical agent that looks like LangGraph → model → ChatAnthropic → tools → search_memory. Every trace carries its status,
timestamp, and the agent, workspace, and environment it ran in.
Reading a trace
Open a trace to see the whole run. The header shows its status, duration, span count, tokens, and cost; below it, a waterfall lays the spans out on a timeline so you can see where the time went, and each span shows its own input and output.
Filtering traces
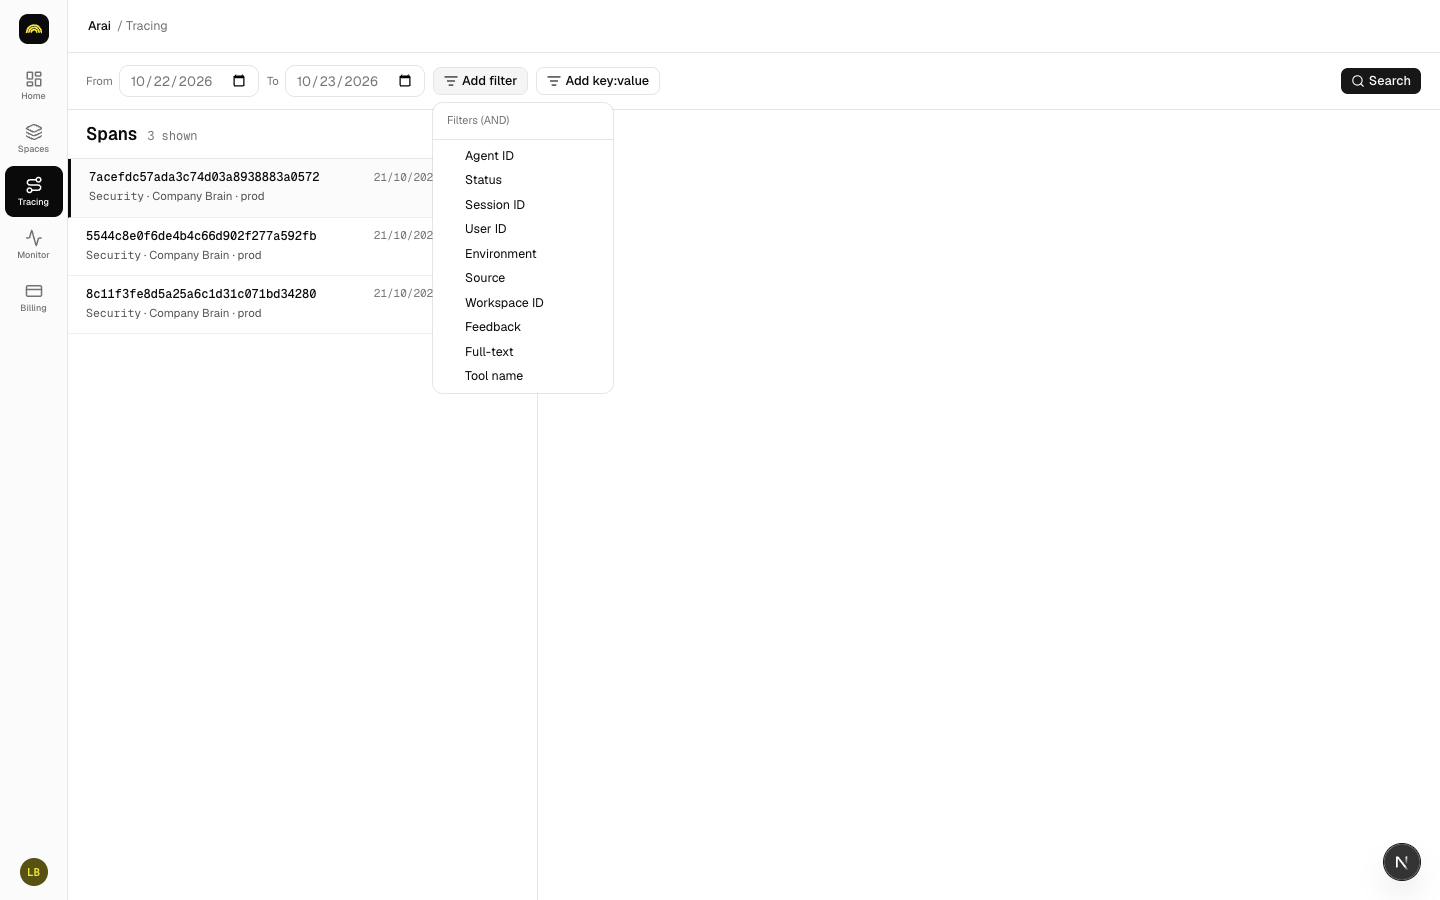
Pick a From and To date to set the window, then narrow the list with Add filter:
- Agent ID, Status, Session ID, User ID, Environment, and Source — exact matches on a run's attributes.
- Workspace ID — scope to a single workspace.
- Feedback — keep only runs an end user rated up or down.
- Full-text and Tool name — search within the run's content.
For anything else, Add key:value matches a metadata key/value pair or a tag. Filters combine with AND; press Search to apply them.