Monitoring
Monitoring rolls your traces up into an at-a-glance view of how every agent is performing — errors, throughput, and latency — across all your workspaces, from metrics collected in your own account.
What monitoring shows
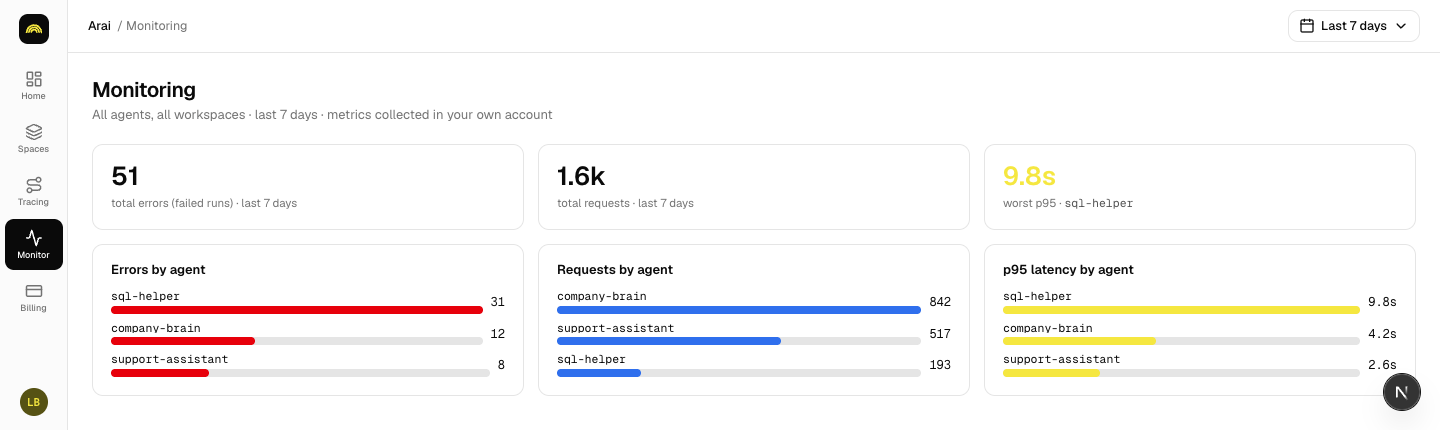
One dashboard for all agents and workspaces over a time range. Three summary cards sit at the top; below them, the same metrics are broken out per agent, so you can spot which agent is driving a spike.
The metrics
- Total errors (failed runs) — how many runs failed in the window.
- Total requests — how many runs your agents served.
- Worst p95 — the highest 95th-percentile latency across agents. p95 is the time 95% of runs came in under, so it tracks the slow tail rather than the average.
Each metric also appears as a per-agent chart — Errors by agent, Requests by agent, and p95 latency by agent — so you can compare agents directly.
Choosing a time range
Use the range selector to switch between the last 7, 15, or 30 days, or set a custom range with explicit start and end dates. Every card and chart updates to the window you pick.
Was this page helpful?Edit this page